
Where Mothers And Newborns Die: What State-Level Mortality Data Reveals About Healthcare Access
The same states with the worst maternal outcomes are about to absorb the biggest Medicaid cuts.

In states where more than 60% of voters chose Trump in 2020, maternal mortality runs above 37 per 100,000 live births. In states below 35%, it runs closer to 10. The correlation is ecological, not causal. But the policy mechanisms that connect them are not a mystery. And now those mechanisms are being cut.
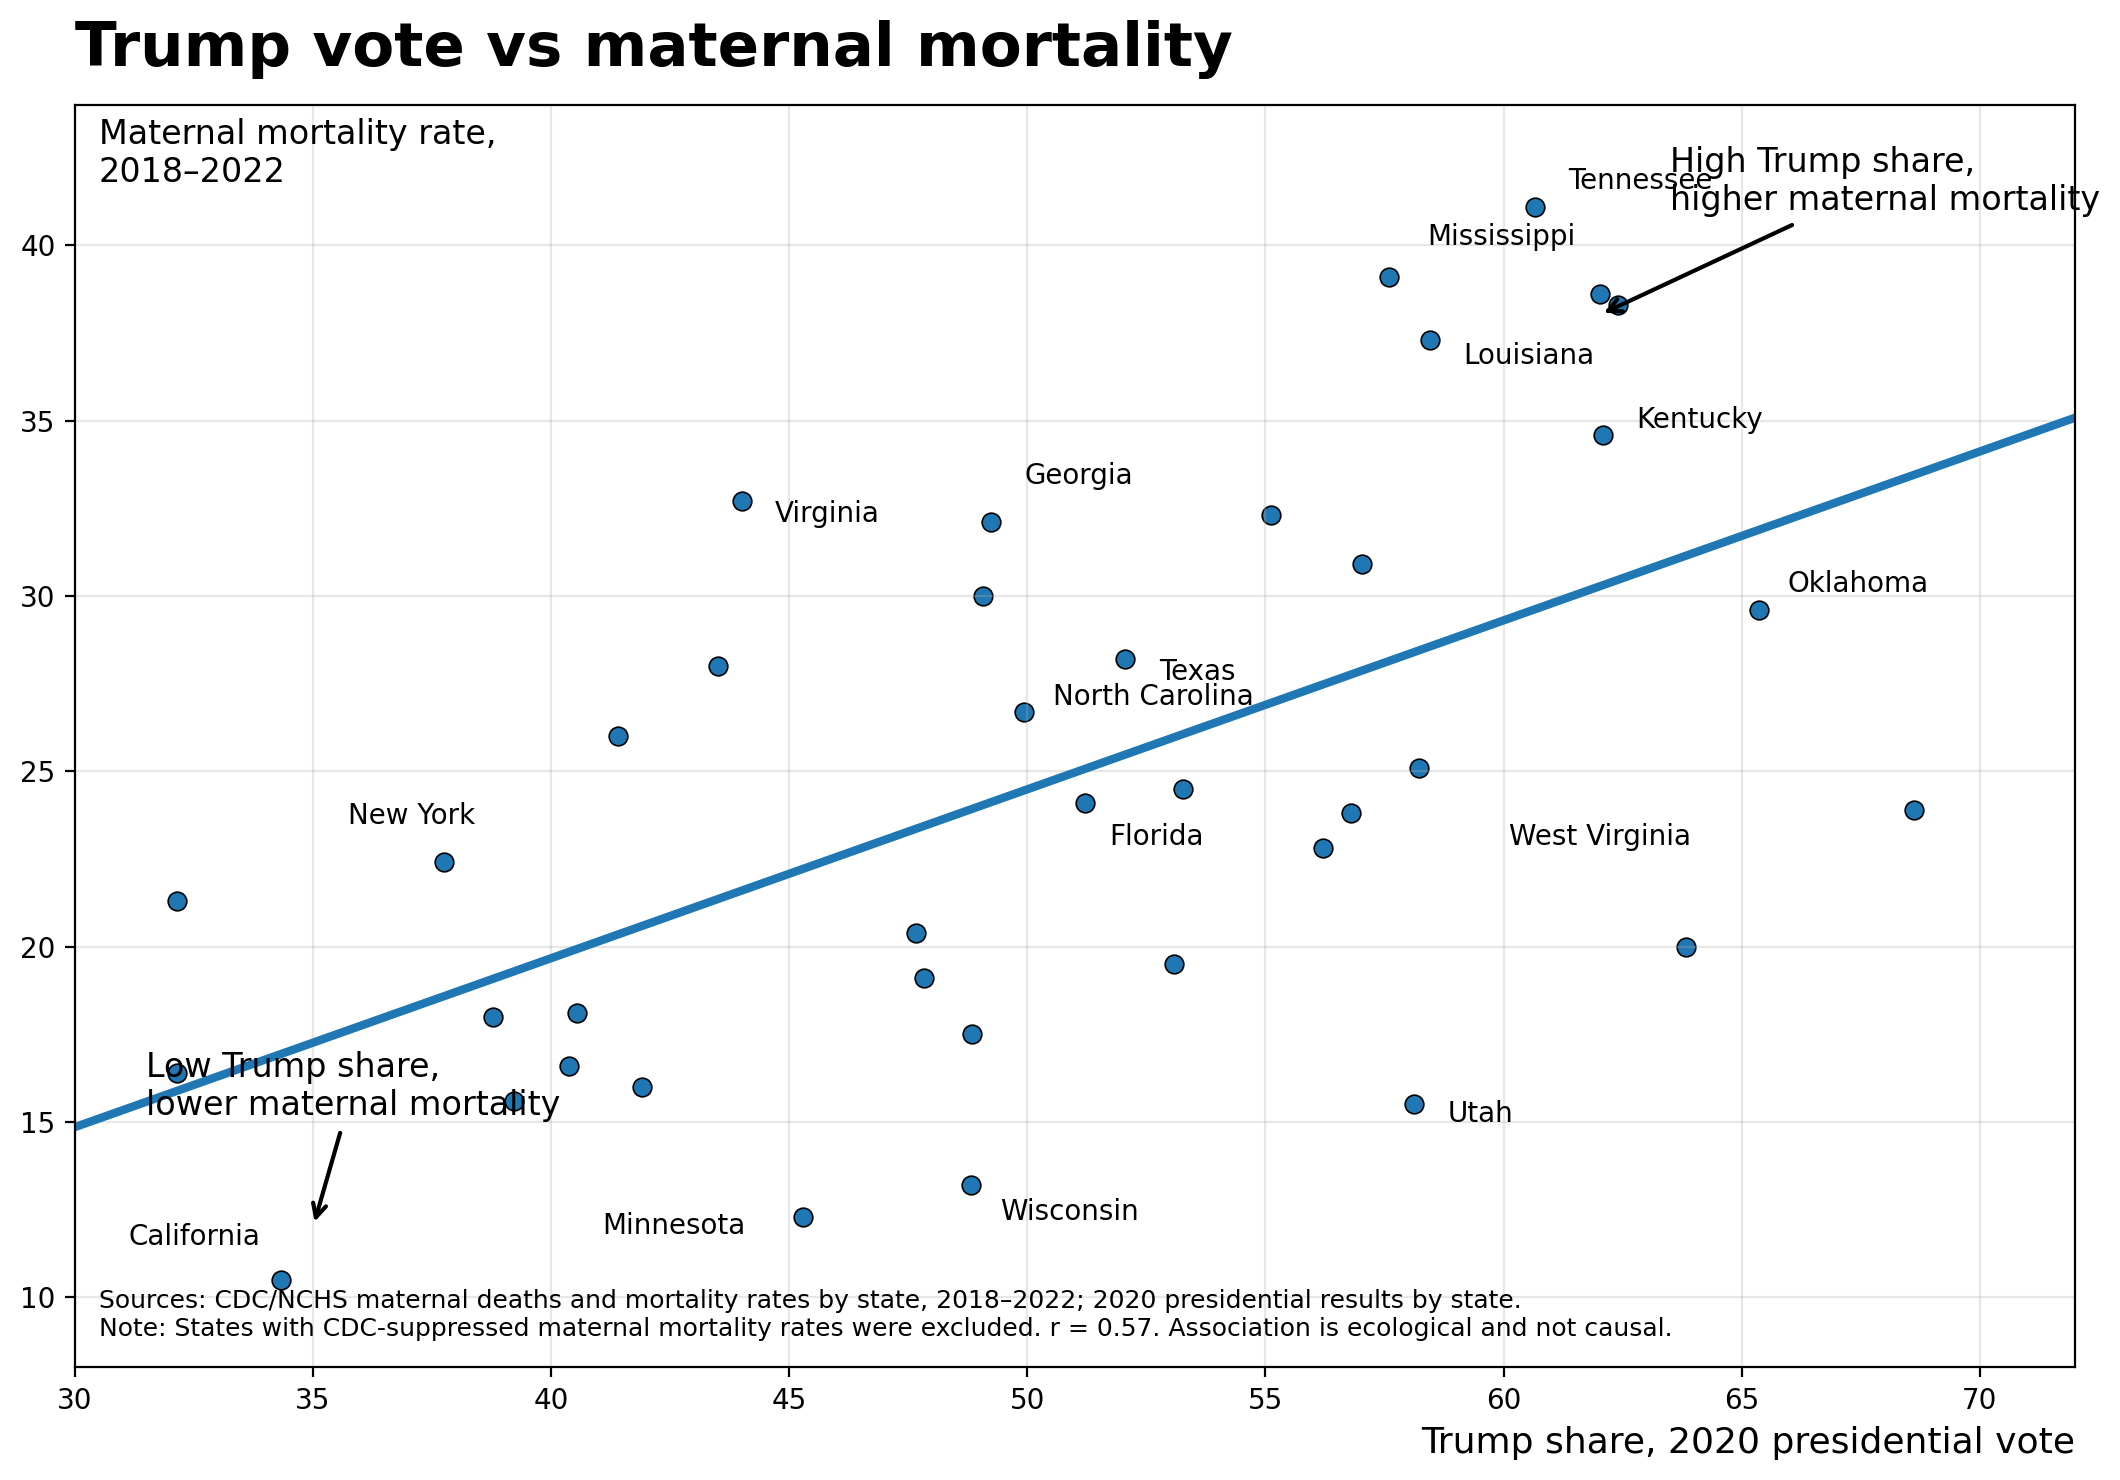
Tennessee has a maternal mortality rate of 41 per 100,000 live births.
California’s is 10.
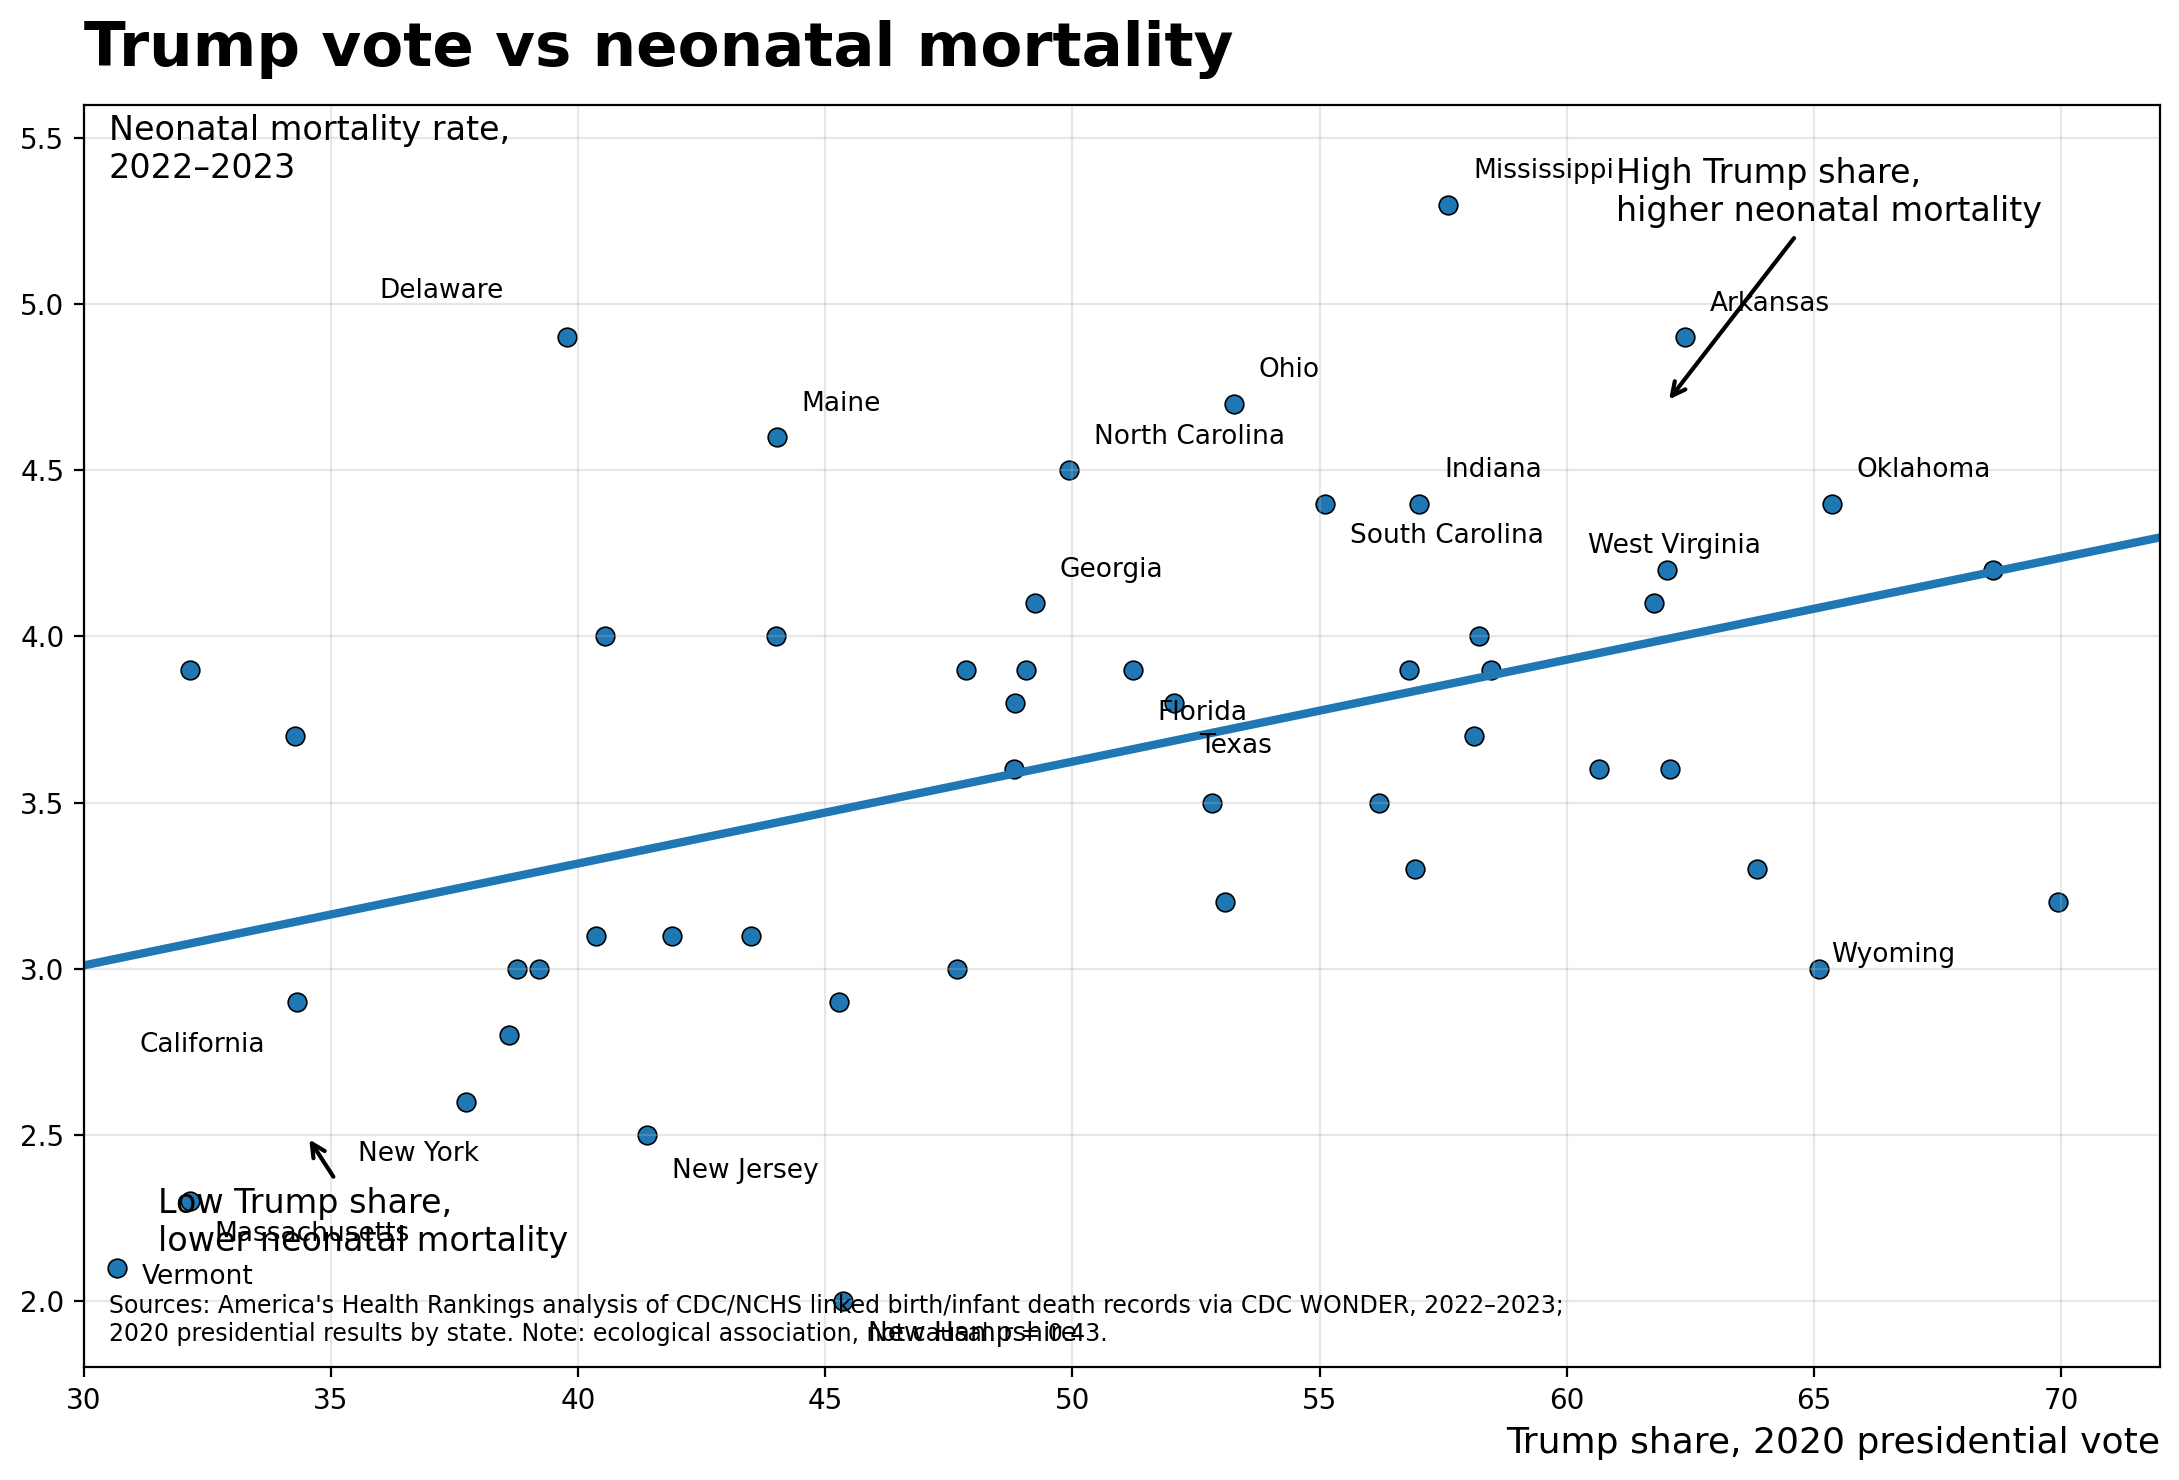
Mississippi’s neonatal mortality rate is 5.3 per 1,000 live births.
Vermont’s is 2.1.
These are not random numbers. Two datasets, drawn from CDC/NCHS vital statistics and America’s Health Rankings analyses of CDC WONDER, show the same pattern: states with higher Republican presidential vote shares in 2020 have substantially worse maternal and neonatal mortality.
The maternal mortality correlation coefficient is 0.57. For neonatal mortality, it is 0.43. Both charts note explicitly that these are ecological associations, not causal ones. That disclaimer matters, and I will return to it. But a correlation coefficient of 0.57 is not noise. It is a signal that demands explanation.
What the Data Actually Show
The maternal mortality scatter plot covers 2018 to 2022, using CDC/NCHS state-level rates. The neonatal mortality plot covers 2022 to 2023 from America’s Health Rankings. Both use 2020 presidential vote share as the X-axis. In both charts, the fitted regression line runs upward left to right: states with lower Republican vote shares cluster toward the bottom, states with higher vote shares cluster toward the top.
The outliers are instructive. Utah votes heavily Republican and has a maternal mortality rate around 15.5 per 100,000 -- well below the trend line.
West Virginia sits high-Trump and relatively moderate on maternal mortality compared to Mississippi or Tennessee.
Delaware, a blue state, has a neonatal mortality rate near 4.9. No correlation in population-level data is clean.
What matters is the pattern across dozens of states, not any single data point.
The pattern is real. In states that voted more than 60% for Trump in 2020, maternal mortality consistently runs above 37 per 100,000 live births. In states below 35% Trump share, it runs closer to 10 to 13. That is a three-to-four-fold difference in the rate at which women die from pregnancy-related causes, depending on which state they live in.
Correlation Is Not Causation -- But the Mechanisms Are Not a Mystery
This matters: voting Republican does not cause maternal death. The ecological fallacy reminds us that state-level associations do not translate to individual-level causation. A state’s average vote share and its average mortality rate are population-level statistics, and we cannot infer that any individual voter is at elevated risk because of her politics.
What we can ask is why these two variables track together at the state level. And here the answer is not mysterious. It is healthcare policy. The states that vote most heavily Republican are, with notable exceptions, the same states that rejected Medicaid expansion under the Affordable Care Act, that have the fewest OB/GYN physicians per capita, that have enacted the most restrictive abortion laws (which have well-documented downstream effects on obstetric care capacity and physician recruitment), and that have the highest proportions of rural counties without a labor and delivery unit.
Medicaid finances 41% of all births in the United States nationwide. In Louisiana, Mississippi, New Mexico, and Oklahoma, more than half of all births are Medicaid-financed. These states are also among the highest on both mortality curves. Medicaid is not a peripheral program for maternal health. It is the program. Remove it or restrict it, and you are removing the financial infrastructure that keeps maternity care functioning in the communities where it is most needed.
There is also the abortion care dimension, which clinicians are not permitted to ignore. Since 2022, multiple states have enacted near-total abortion bans. The evidence is accumulating that these laws reduce the obstetric workforce, deter medical students from training in affected states, and create clinical paralysis when physicians face pregnancy complications that technically qualify as emergencies but carry legal risk. Maternal mortality in states with abortion bans is a topic that requires its own post. But anyone reading these scatter plots should understand that the political and clinical environments are not separate.
What the Federal Budget Just Did to These States
On July 4, 2025, the One Big Beautiful Bill Act was signed into law. The legislation cuts federal Medicaid funding by approximately $1 trillion, or roughly 15%, over ten years. The nonpartisan Congressional Budget Office estimates that 11.8 million individuals will directly lose Medicaid health insurance coverage as a result, with an additional 3.1 million losing Medicaid coverage under marketplace plans.
The states that are highest on both mortality scatter plots are the states where Medicaid coverage of births is most concentrated. Families USA estimates that more than half of births in Louisiana, Mississippi, and Oklahoma are financed by Medicaid. The National Partnership for Women and Families has estimated that more than 140 labor and delivery units will close under the cuts. The National Rural Health Association projects rural hospitals will face as much as $70 billion in reduced funding. These are not distant projections -- they describe what happens to the clinical infrastructure of the states already sitting in the upper-right quadrant of both graphs.
The law also introduces new administrative work requirements for Medicaid eligibility, which the Commonwealth Fund and multiple maternal health organizations have identified as creating particular risk for women of reproductive age who are not employed for pay due to childcare, illness, or school attendance. Consistent coverage before, during, and after pregnancy is not optional -- it is how preventable maternal deaths get prevented. Gaps in coverage during pregnancy are associated with delayed prenatal care, unmanaged chronic conditions, and worse outcomes at delivery. Forty-eight states had extended postpartum Medicaid coverage to 12 months. The cuts put that extension at serious risk as states face budget shortfalls they did not choose.
What Patients Should Know
If you live in a state with a maternal mortality rate above 30 per 100,000 live births -- Tennessee, Mississippi, Louisiana, Georgia, Kentucky among them -- you should know that the risk difference between your state and a lower-mortality state is not explained just by biology or by the complexity of your pregnancy.
It is explained largely by the healthcare system around you: how many OB/GYNs practice in your county, whether the nearest hospital has a labor and delivery unit, whether your insurance covers your prenatal visits without administrative barriers.
Medicaid is not a safety net program for someone else.
It is the program that financed your neighbor’s delivery, your county’s only OB, and potentially your own postpartum care. When 11.8 million people lose Medicaid coverage, the effects do not stay within that group. They ripple through clinics and hospitals that serve mixed-payer populations and that may no longer be financially viable when a substantial share of their revenue disappears.
Ask your state legislators whether they plan to maintain the 12-month postpartum Medicaid extension. Ask your congressional representatives how they voted on the One Big Beautiful Bill Act. These are not abstract policy questions. They are questions about whether the labor and delivery unit nearest you will still be open in three years.
My Take
I have been practicing obstetrics for more than 50 years. I have watched maternal mortality statistics be debated, dismissed, recalculated, and reframed. What I know from that experience is this: a maternal mortality rate of 41 per 100,000 in Tennessee and 10 per 100,000 in California does not reflect a difference in how sick or complex those patients are.
It reflects a difference in resources. Period.
The scatter plots circulating in health policy circles are not partisan attack documents. They are descriptive epidemiology with an honest methodological caveat -- ecological association, not individual causation -- printed right on the chart. The researchers who produced them were transparent. The correlation is real, the mechanisms are identifiable, and the policy response is now law.
The states where mothers are most likely to die from pregnancy-related causes will absorb cuts to the very program that finances those mothers’ care. The states where neonatal mortality is highest will lose labor and delivery units in rural counties that already have too few. We are not predicting a possible future outcome. We are describing the predictable consequence of cutting $1 trillion from Medicaid in a country where Medicaid is the largest single payer for childbirth.
These two scatter plots show a correlation. The federal budget signed on July 4 is about to run a natural experiment on whether that correlation can be made worse.
My prediction: yes, it can.
If you are a free subscriber and you found this useful, a paid subscription supports independent, evidence-based coverage of the questions in women’s health that the major professional societies too often leave unanswered.
References
1. CDC/NCHS. Maternal deaths and mortality rates by state, 2018-2022. National Center for Health Statistics. Available from: https://www.cdc.gov/nchs/ [As shown in graph source line; individual state-level report citation to be confirmed -- VERIFY DOI/URL]
2. America’s Health Rankings. Analysis of CDC/NCHS linked birth/infant death records via CDC WONDER, 2022-2023. United Health Foundation. Available from: https://www.americashealthrankings.org [VERIFY current URL]
3. Joyce D, Marceno L, Eisen H. Medicaid cuts could increase maternal mortality and jeopardize women’s health. Commonwealth Fund; May 2025. Available from: https://www.commonwealthfund.org/blog/2025/medicaid-cuts-could-increase-maternal-mortality-and-jeopardize-womens-health
4. Guttmacher Institute. New federal Medicaid cuts will devastate coverage for reproductive health care; November 2025. Available from: https://www.guttmacher.org/2025/11/new-federal-medicaid-cuts-will-devastate-coverage-reproductive-health-care
5. Georgetown University Center for Children and Families. Pregnant women, infants, young children are not protected in proposed Medicaid cuts; July 2025. Available from: https://ccf.georgetown.edu/2025/07/01/worth-repeating-pregnant-women-infants-young-children-are-not-protected-in-proposed-medicaid-cuts/
6. National Partnership for Women and Families. At risk: critical Medicaid benefits for moms; April 2025. Available from: https://nationalpartnership.org/report/at-risk-critical-medicaid-benefits-for-moms/
7. Congressional Budget Office. Estimated budgetary effects of H.R.1, One Big Beautiful Bill Act; 2025. [VERIFY final CBO report citation and DOI]
8. Families USA. The biggest threats to maternal health lurking in President Trump’s health care cuts; September 2025. Available from: https://familiesusa.org/resources/the-biggest-threats-to-maternal-health-lurking-in-president-trumps-health-care-cuts/